LinkedIn
 X
X When "listening" isn't the whole story: enhanced listener status in Boomi

Listeners in Boomi run across multiple JVM instances depending on your runtime type:
- Basic runtime: single JVM, one instance
- Runtime cluster: N cluster nodes, each running the listener independently
- Runtime cloud: up to N execution worker instances per tenant
Previously, all of these collapsed into a single top-level status: listening, paused, or errored. That's fine for a single-node basic runtime. But if you're running a Runtime cluster or Runtime cloud with a dozen workers or nodes, it leaves a real blind spot. Here's what that blind spot looks like in practice.
Picture this: you're running a Runtime cluster with eight nodes, each handling a JMS listener connected to the same queue. One node loses its connection to the JMS broker. The listener registered fine at startup, the runtime still sees it as running, but it's no longer receiving messages. Check the Platform, and you'll see Status: Listening. Everything looks fine. Your monitoring is green, a false sense of health that lasts until a downstream system reports missing data, usually hours later. The whole time, messages are quietly piling up on the queue or falling through the cracks (refer to the Before vs After graphic).
That's exactly how listener observability worked in Boomi until recently: a single failing node can silently drop messages while the aggregate status remains listening, and you had to dig through container logs to find out what was actually going on. Enhanced Listener Status fixes that. It adds per-instance visibility and a new degraded aggregate state to the Listener Status API, so you get the granular error details you need to catch partial failures without digging through container logs, and you can automate lifecycle management with much more confidence.
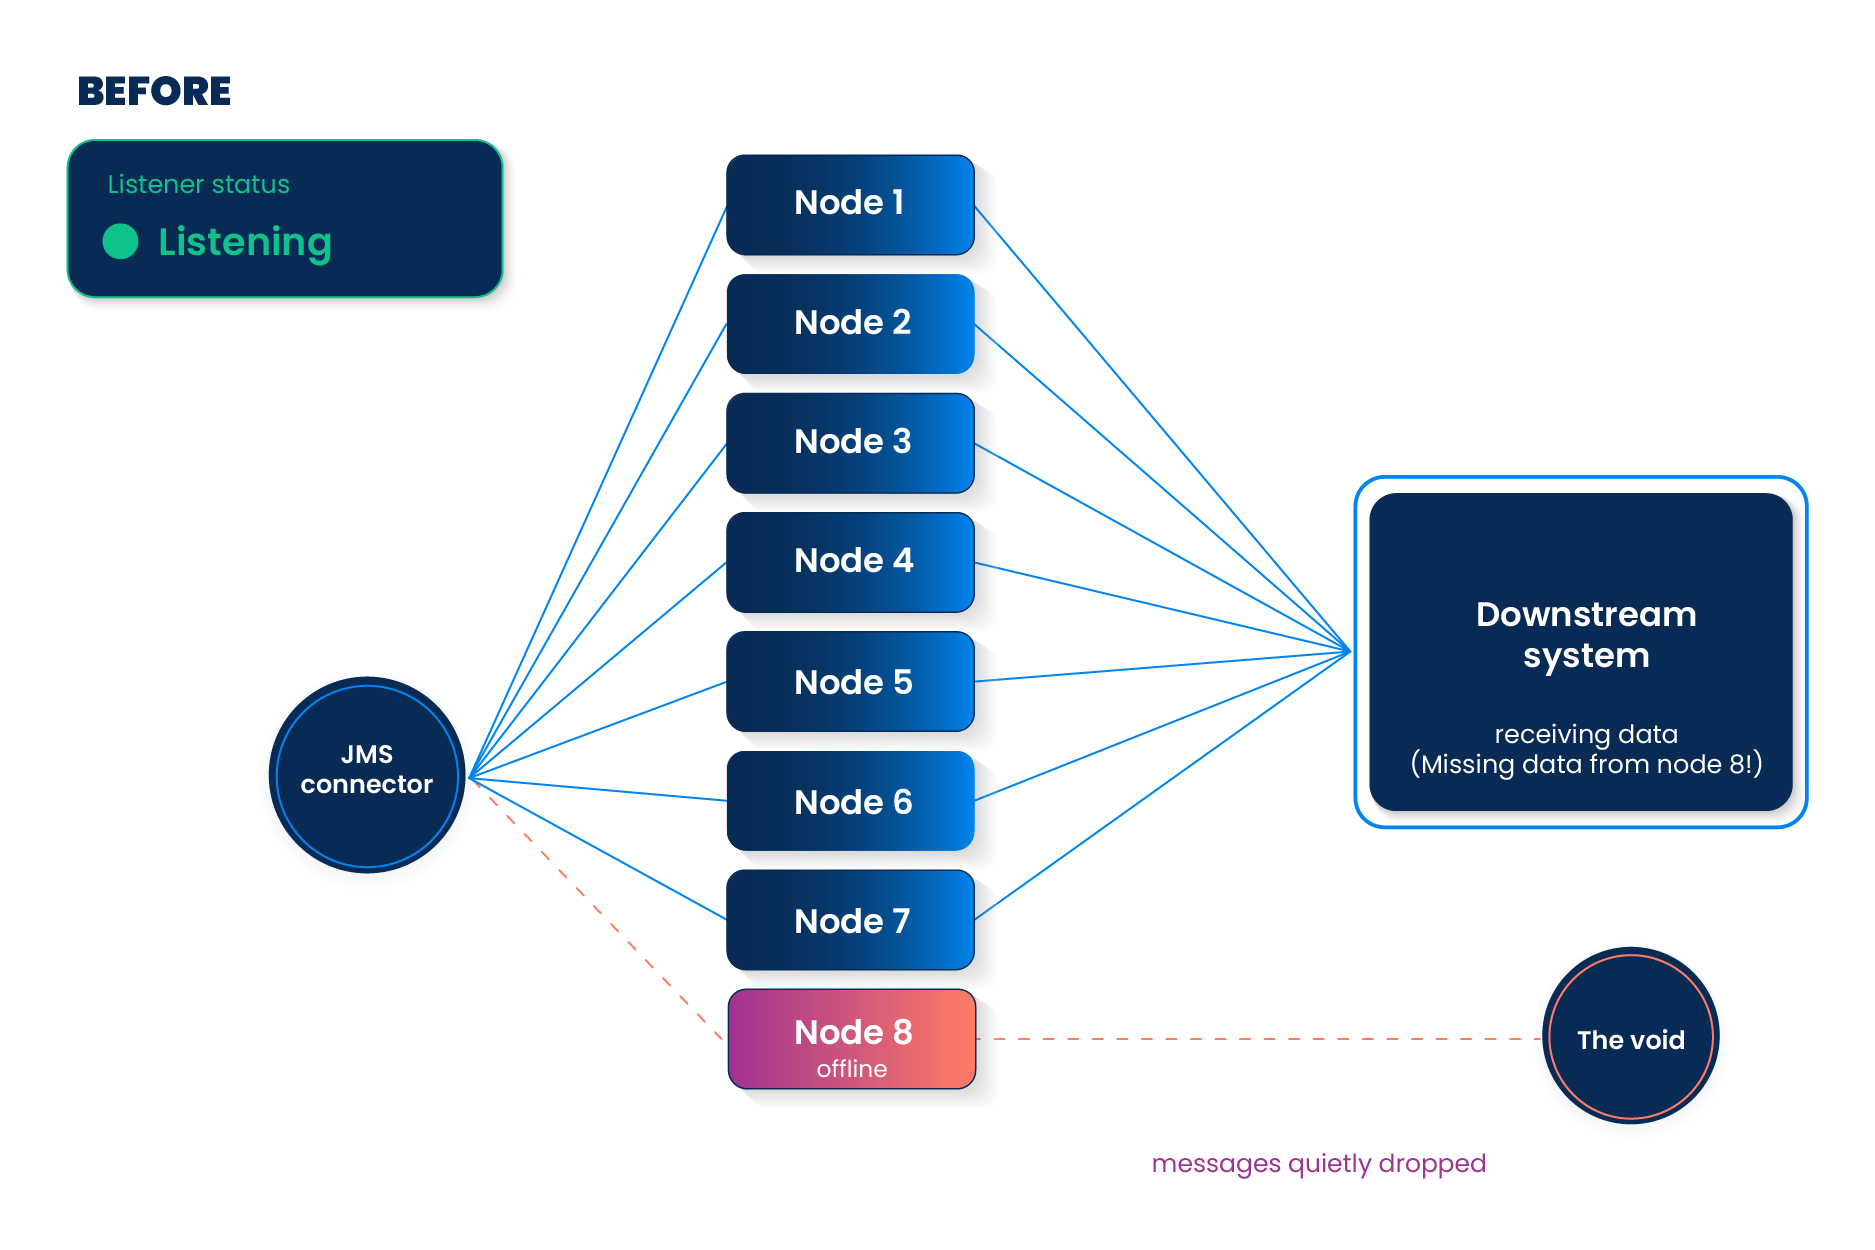
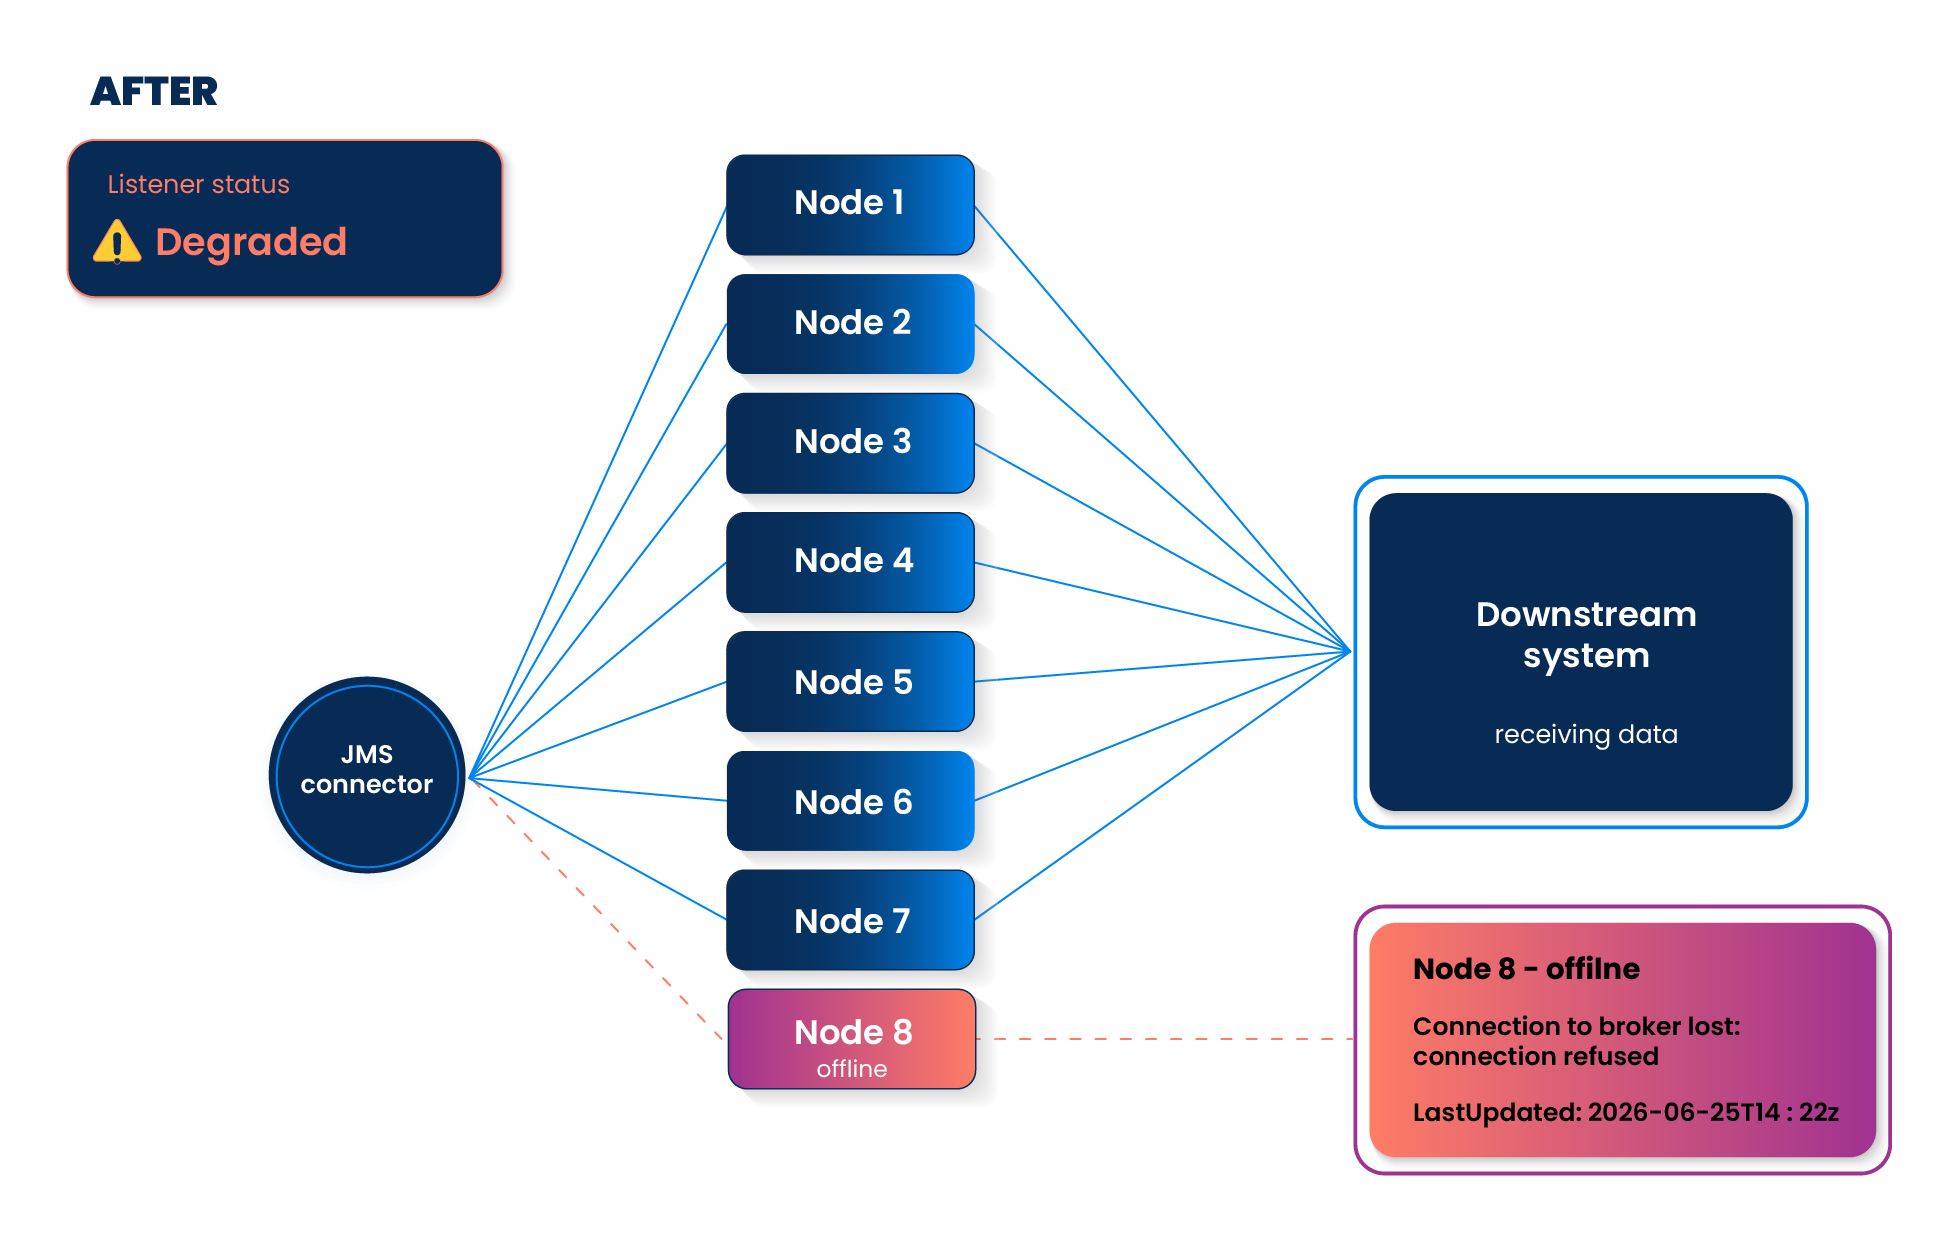
Here's what changed, how to read it, and how to use the API to build smarter automation around your listener lifecycle.
What's new: per-instance details and the degraded status
Enhanced Listener Status adds two things to the API response. For the full API reference, refer to ListenerStatus.
-
A
detailsarray per listenerEach listener entry now includes a details array with one entry per worker instance:
{"@type": "ListenerStatus","listenerId": "979e40a7-d739-4297-953c-5c443f8bfa36","status": "degraded","connectorType": "http","details": [{"instanceId": "atom01","status": "started","lastUpdated": "2026-04-17T20:40:57Z"},{"instanceId": "atom02","status": "errored","message": "Address already in use: bind","stackTrace": "java.net.BindException: Address already in use...","lastUpdated": "2026-04-17T20:43:29Z"}]}Each entry gives you:
instanceId: which node or worker this isstatus: what that specific instance is doingmessageandstackTrace: exactly what went wrong, no log access neededlastUpdated: when this instance last changed state
-
A new aggregate status:
degradedThe existing statuses (
listening,paused,errored) remain unchanged to ensure backward compatibility.degradednow covers the grey area:Status Type Description listeningExisting All instances are healthy (online/started). pausedExisting All instances are paused (user action). erroredExisting All non-pending instances that failed to start may require redeployment/restart to recover. The user might need to make a change and then restart. degradedNew Any unhealthy state — mixed, offline, unknown, or pending. That last row is the one that matters. A Runtime cluster where 7 of 8 nodes are healthy but one is unreachable? Previously
listening. Now correctlydegraded.
Per-instance statuses
Once you're looking at the per-node level, you'll see one of seven statuses. Most are self-explanatory, but two are easy to confuse: errored and offline. errored means the instance hit an exception at startup and won't recover on its own; you'll need to intervene. offline is different: it also signals a problem after startup, but it's often transient, and the connector may recover on its own without you doing anything.
| Status | Description |
|---|---|
online | The instance is healthy and actively confirmed. |
offline | Error after startup: may self-recover. |
started | Registered successfully, running normally. |
errored | Exception at startup: won't recover on its own, requires intervention. |
paused | User-initiated pause. |
pending | Queued to start, or initial state before startup begins (for example, a singleton listener on a non-active Runtime cluster node). |
unknown | No response from the JVM: timeout or unreachable. |
Connector-reported statuses: "online" and "offline"
online and offline aren't guaranteed statuses; you'll only see them if the connector implements Boomi's enhanced status reporting model: an extension of the listener SDK that lets connectors actively push their health state at runtime, after startup.
In practice, the enhanced reporting model works like this: once a connector confirms that its connection to the underlying system is healthy, it reports online. If that connection later drops or gets interrupted, it reports offline, and either status can carry an optional message and stackTrace so you get connector-level diagnostics right in the API response.
For example, a connector that starts fine but then loses its broker connection might report:
{
  "instanceId": "node-1",
  "status": "offline",
  "message": "Connection to broker lost: connection refused",
  "lastUpdated": "2026-06-25T14:22:11Z"
}
If a connector doesn't implement this model, you won't see online or offline at all; it just reports started once it's running, and that's it. The practical difference for automation: offline is a connector-reported signal that may self-recover, while errored is a runtime-caught startup failure that won't come back without intervention.
Using the Listener Status API
The API follows Boomi's standard async token pattern.
Step 1: Submit a query
POST /api/rest/v1/{accountId}/async/ListenerStatus/query
{
  "QueryFilter": {
    "expression": {
      "operator": "and",
      "nestedExpression": [
        {
          "argument": ["b84550e0-deba-4b9f-ae21-99748efe70a9"],
          "operator": "EQUALS",
          "property": "containerId"
        }
      ]
    }
  }
}
containerId is required. Add a listenerId to scope the query to a specific listener process, or omit it to retrieve all listeners on that runtime. Only EQUALS is supported for both filters.
If you have a high volume of listeners, always include the optional listenerId to scope your query and reduce processing time.
You'll receive an async token:
{
  "@type": "AsyncOperationTokenResult",
  "asyncToken": {
    "token": "ListenerStatus-fbbf05cc-75b6-4266-aaf0-48e8a3019b2a"
  },
  "responseStatusCode": 202
}
Step 2: Poll for results
GET /api/rest/v1/{accountId}/async/ListenerStatus/response/{token}
A responseStatusCode: 202 in the response body means the runtime is still collecting status; retry after a short delay. A responseStatusCode: 200 means your results are ready.
This two-step pattern is intentional: the Platform fans out the request to the runtime, waits for a response, and caches the result. For large Runtime clusters, this can take a few seconds.
Seeing it in action: a real degraded scenario
It's Tuesday afternoon. You have a 3-node Runtime cluster running an HTTP listener on port 9090 that receives webhook payloads from an external payment provider. All three nodes have been healthy since the morning deployment.
During a routine OS update on node 2, a system process starts and binds to port 9090 before your listener can reclaim it on restart. Node 2's listener fails to start. Nodes 1 and 3 are still receiving webhooks normally.
Before Enhanced Listener Status, the API would have returned this errored status:
{
  "@type": "ListenerStatus",
  "listenerId": "979e40a7-d739-4297-953c-5c443f8bfa36",
  "status": "errored",
  "connectorType": "http"
}
Something is wrong, but that's all you know. You have no idea which of the three nodes failed, or even that any nodes are still healthy and serving traffic. You might restart the entire listener across all nodes when only one needs attention. Either way, you are digging through container logs for every node to find out what happened.
Now, the same query returns:
{
  "@type": "ListenerStatus",
  "listenerId": "979e40a7-d739-4297-953c-5c443f8bfa36",
  "status": "degraded",
  "connectorType": "http",
  "details": [
    {
      "instanceId": "node-1",
      "status": "started",
      "lastUpdated": "2026-06-25T14:15:02Z"
    },
    {
      "instanceId": "node-2",
      "status": "errored",
      "message": "Address already in use: bind",
      "stackTrace": "java.net.BindException: Address already in use: bind\n\tat java.base/sun.nio.ch.Net.bind0(Native Method)...",
      "lastUpdated": "2026-06-25T14:14:58Z"
    },
    {
      "instanceId": "node-3",
      "status": "started",
      "lastUpdated": "2026-06-25T14:15:01Z"
    }
  ]
}
The aggregate is degraded because nodes 1 and 3 are healthy, while node 2 failed: a mixed state. Node 2's errored instance status tells you it won't recover on its own.
- Nodes 1 and 3 are healthy
- Node 2 failed at 2:14:58pm with a port conflict;
BindException: Address already in use - This won't self-resolve. The port needs to be freed on that machine before the listener can be restarted
Without this, you're waiting for the payment provider to report failed webhooks, then digging through container logs on each node to find which one has the port conflict. With Enhanced Listener Status, the answer is in the API response.
What this means for automation
If you're using the Listener Status API to automate listener lifecycle management: checking status before triggering a pause, building a custom health dashboard, or integrating with an external monitoring system, here's how to make the most of the new data:
-
Alert on
degraded, not justerroredMost monitoring setups only fire on
errored. With Enhanced Listener Status,degradedis often the earlier signal: a node that wentunknownorofflinewill surface asdegradedbefore the whole listener tips intoerrored. Setting up alerts on both statuses gives you an earlier warning with more time to react. -
Use details to skip the log hunt
When a listener is in a bad state, the
messageandstackTracefields in the details array provide the specific failure reason for each instance: port conflict, connection refused, or timeout. For Runtime clusters especially, this means you can identify which node is the problem without needing SSH access to the cluster. -
Check status after lifecycle operations
After calling pause, resume, or restart, the status doesn't update instantly; the runtime has to propagate the action to each worker. Polling the Listener Status API after a lifecycle operation lets you confirm the action took effect across all instances before moving on. With details, you can see exactly which instances have transitioned.
-
Watch
lastUpdatedfor connectors that implement enhanced reportingFor connectors that report
onlineandoffline,lastUpdatedreflects real health transitions and is worth monitoring for staleness. For connectors that stay atstarted, the timestamp reflects startup time and won't change: a "stale" timestamp there is normal.
The new UI
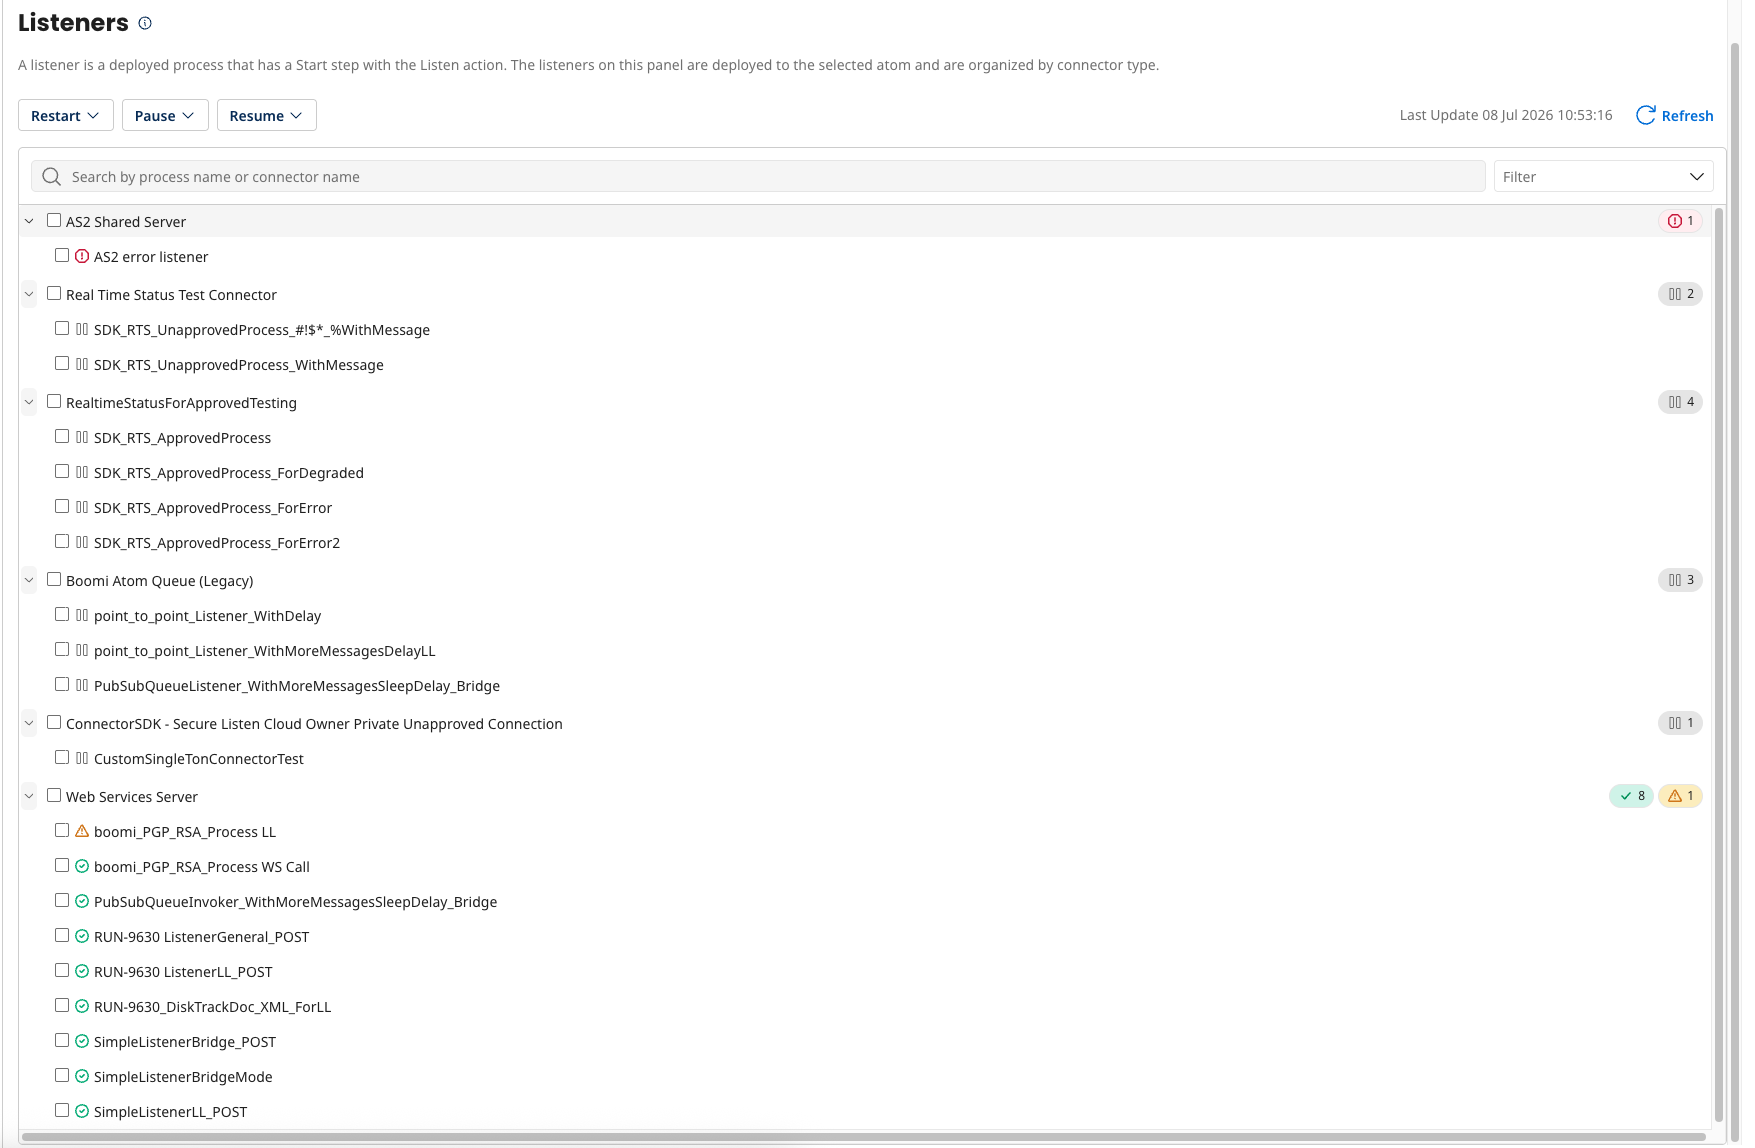
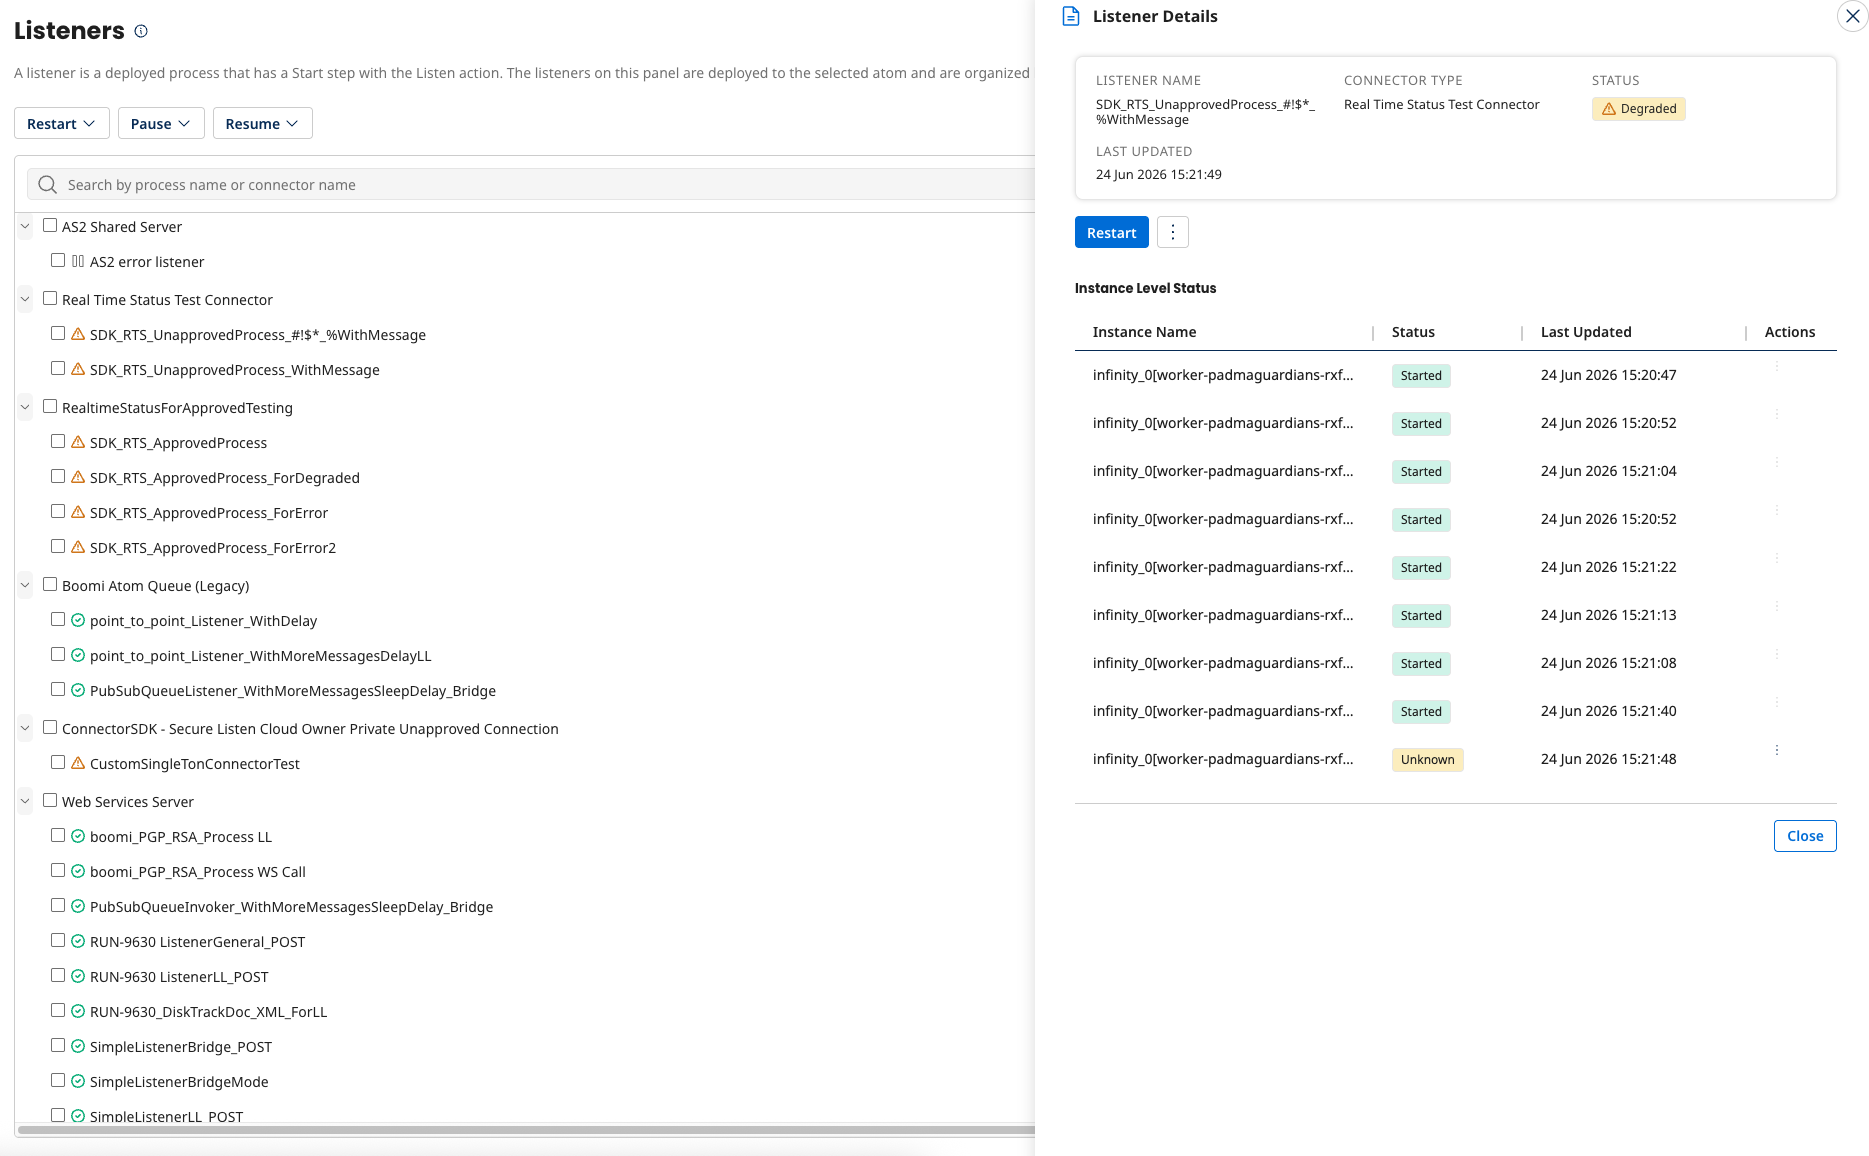
Alongside the API changes, Listener Reporting panel in Boomi Enterprise Platform has been rebuilt. It now shows:
- Listeners grouped by connector type, with color-coded count badges for
listening,paused,errored, anddegraded. - Status and name filters so you can zero in on just the problematic listeners.
- A details drawer for each listener that surfaces per-instance status, error messages, and stack traces without leaving the UI.
- Bulk restart, pause, and resume actions across all listeners or just selected ones.
The degraded state gets its own visual treatment (yellow/warning) distinct from errored (red), making it immediately clear whether something needs urgent attention or is likely to self-recover.
Backward compatibility
The details array and degraded status are now part of every Listener Status API response. If you have existing automation that checks listener status values, add handling for degraded before relying on it in production; it's a new possible value that wasn't returned before.
If you operate Boomi integrations at any scale beyond a single basic runtime, listening was never really telling you the whole story. Enhanced Listener Status gives you the per-node granularity to catch partial failures early, get error context without log access, and build more reliable automation around your listener lifecycle.
Ready to build? Dive into the Listener Status API docs and explore what's possible. Share what you create in the Community Forum or drop a comment — we'd love to hear from you.