Enabling observability for runtimes using the RuntimeObservabilitySettings API
As a site reliability engineer managing multiple runtimes, clusters, or runtime clouds, a managed service provider (MSP) overseeing many customer environments, or a platform team supporting internal integration users, you do not need to log in to each runtime individually to see what is happening.
The RuntimeObservabilitySettings API lets you enable and configure observability for a runtime programmatically, without using the UI. The Runtime Telemetry plugin streams telemetry data (metrics, logs, and traces) in real time to an endpoint application of your choice, such as New Relic, Datadog, or any OpenTelemetry-compatible tool.
Why the RuntimeObservabilitySettings API replaces manual monitoring?
Before the Runtime Observability feature existed, gaining visibility into a runtime required manual work. You had to check worker, runner, and base container logs in the installation directory, or connect through SSH (Secure Shell) to the underlying EC2 instance if you did not install the container locally. To gather metrics such as CPU use, thread count, or system load, you had to run JMX (Java Management Extensions) commands or connect through VisualVM, one runtime at a time, unless you used the Runtime Observability Settings UI.
The RuntimeObservabilitySettings API replaces this manual, per-runtime configuration with programmatic control over the observability plugin. It lets you apply and update settings consistently across all the runtimes you manage.
This API is useful when you need to:
- Identify problems before customers report them: Stream CPU, thread count, system load, and process duration from the plugin into your existing alerting system, so a degrading runtime automatically triggers a page.
- Reduce incident investigation time: Export traces from the plugin so you can pull up the span tree for a specific process execution in your endpoint application to see which process step failed and how long each step took, without accessing the runtime host.
- Centralize log retention: Stream worker, runner, and process execution logs from the container to your endpoint application in real time. This helps when local log rotation does not meet your audit or compliance needs.
- Standardize observability across many runtimes at once: Configure the same telemetry export settings across dozens or hundreds of runtimes using repeatable API calls instead of configuring each runtime through the UI.
Prerequisites
- API authentication credentials and your account ID.
- The runtime ID of an online, active runtime, cluster, or runtime cloud.
- The Runtime Management privilege.
- If you are configuring observability for a cloud attachment, the cloud owner must first enable attachment-level observability for your attachment, using the cloud's Enable Attachment Observability advanced property and the attachment's Observability quota. If this option is not available, contact your cloud owner. For Boomi-hosted DCS and MCS runtime clouds, attachment observability is rolling out gradually and is not yet available for PCS attachments.
- A gRPC (Google Remote Procedure Call) endpoint application URL from an OpenTelemetry-compatible tool, such as New Relic or Datadog, along with its authentication credentials. The runtime exports all telemetry data over gRPC. If your endpoint application requires HTTP or protobuf, route the data through a third-party OpenTelemetry collector instead.
- Optional: connection details for a local collector, if you use one instead of connecting directly to the monitoring tool.
To learn more about authenticating your API calls, refer to Getting started with Boomi Platform APIs.
Workflow
-
Check the runtime's current observability configuration using the asynchronous GET operation. This step is optional if you are configuring observability for the first time.
-
Send a POST request that specifies your endpoint application details and the telemetry signals you want to export (metrics, logs, and traces).
-
Confirm that telemetry data arrives at your endpoint application, then set up dashboards or alerts.
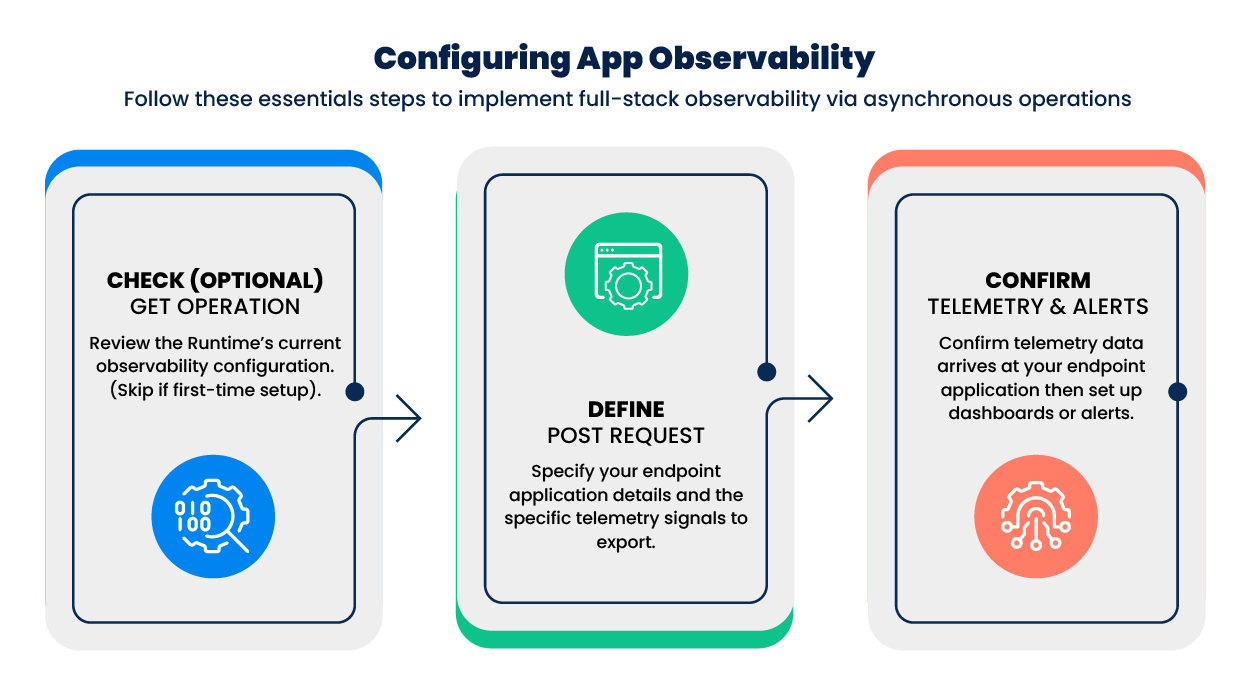
Implementing runtime observability
Step 1: Retrieve current settings
The GET call is asynchronous. It returns an asyncToken, which you use in a follow-up call to retrieve the current RuntimeObservabilitySettings object.
Step 2: Enable observability
Send a POST request with the runtimeId, the telemetry signals to enable, and the endpoint application for the data. Set shouldRestartPlugin to true to apply the change immediately, or to false to apply it at the next manual restart of the plugin. You can also configure logs, metrics, and traces to override the general endpoint application if you want to route them separately.
Step 3: Verify telemetry delivery
After the plugin restarts, confirm that telemetry data is flowing to your endpoint application:
- CPU and thread metrics trend over time.
- Span trees show per-step duration and errors for a given run.
- Log entries arrive in real time.
For complete API details, request and response formats, parameters, and examples, refer to the RuntimeObservabilitySettings API reference.
Additional considerations
- Telemetry data volume scales with execution volume. Some endpoint applications charge by volume, so use log and process filters to export only the data you need.
- Telemetry delivery is not guaranteed during extended network interruptions. Observability does not replace tracking critical business transactions; emit business events for that purpose instead.
- Cloud attachment observability becomes available once the cloud owner enables it. It is rolling out gradually to DCS and MCS runtime clouds and is not yet available for PCS attachments.
- To roll this out across many runtimes at once, for example as an MSP onboarding a new customer or standardizing observability fleet-wide: iterate over a list of runtime IDs, and send the same POST request to each one.